In the mid-60s, the APBA Game Company introduced their basketball game to join their product line. It was very accurate, you actually determined passing before shooting and could strategically move offensive and defensive players across the court. It was also an absolute slog to play, a simple 24-second sequence could take over a minute to play, not to mention all of the math necessary to make new finder tables every time a substitution was made. Multiply that by 200 plays and a single game could take over six hours.
So, APBA later released “super basic” or “short game” rules. These eliminated the dribbling and passing, and laid to game bare to simply doing the shooting and rebounding. Still, each play sequence would take at minimum four dice rolls, which means still 800 dice rolls at minimum, and this would cut the game to four hours.
In 1993, they introduced a new game that eliminated the laborious finder tables. I don’t remember much about this game, I only played it once. Not sure why this game didn’t hold on like the hockey game did, a few seasons were released, and the game was quietly retired.
During the pandemic, I toyed with the idea of making an APBA-style basketball game. I made cards, and charts, and ran a few simulations. It worked OK as a board game, but to be honest I put it aside because frankly I’m not much of a basketball fan, and the interest was just not there.
However, the idea still stuck in the back of my head, and I thought about what it would take to make a reasonable game. My idea was basically to have fast action cards like you see in the soccer game to determine shooters, zones, rebounds, etc. I would not make any cards, it would work on the existing card sets out there, which did limit to what I could do.
My first attempt looked good in theory, but it did not play well. It was too much staring at cards to look at ratings and the game didn’t flow like I had hoped, and gave up playing the game after the first quarter. So I had to simplify it even further.
My second attempt worked much better, using a lot less of card staring and I was able to play a full game in two hours and ten minutes. The 1989 Pistons defeated the 1989 Lakers in a thrilling 90-89 game.
The game boils down to using two types of action cards, one for determining the shooter, and one for determining everything else. For the most part, the dice are only rolled when looking at the player’s card.
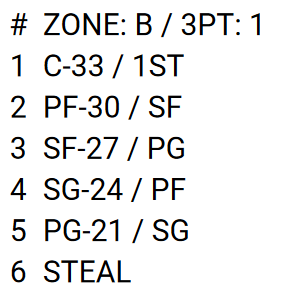
A sample Shooter Card
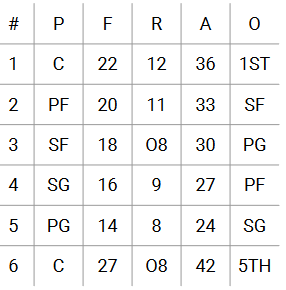
A sample “Everything Else” Card
Before a quarter, a single die roll determines which row will be used for the entire quarter. The shooter is then determined by the card. For example, if the point guard’s shooting rating is 21 or greater, that player would be the shooter, otherwise the shooting guard would take the shot. Post shot, you would draw an “Everything Else” card an determine if you would need to check for the fouler (F), rebound (R), or assist (A). This card works in the same way as the shooter card – find the appropriate rating for the position on the left and if the rating isn’t high enough, use the position in the right-most column. It’s really that simple.
So for now this will be an “open source” game, I am willing to provide the rules, charts, and action cards for free. There are 14 links below, one for the rules, one for the single play chart, six for the shooter cards and six for the “everything else” cards. Simply cut the action cards, find a set of APBA basketball player cards, and you’ll be playing in no time.
If you end up playing a game or two, I would love to see your scoresheets so I can collect play-testing data. I’m curious on how well the game plays. Have fun!
I once saw a stray comment on an APBA Hockey post that defensemen get too many assists. I had never really noticed that until I started looking closer at some of the statistics in my own projects.
One project I play every year is a 10-game, 12-team draft league. Based on the season I last played (2019-20), and adjusting for the assist numbers would be a little higher because a smaller league produces more scoring (25% more goals), pro-rating the assist leaders would produce the following:
Player
Pos
Exp.
Draisatl
F
12
McDavid
F
12
Panarin
F
11
Carlson
D
11
Marchand
F
11
MacKinnon
F
11
Huberdeau
F
10
Kucherov
F
10
However, when the season was done, it was littered with defensemen:
Player
Pos
Exp.
Carlson
D
17
Makar
D
10
Josi
D
10
S. Jones
D
10
Pietrangelo
D
9
4 tied (2 D, 2 F)
F
8
Yikes. Doesn’t look like a typical scoring leader board. With seven seasons in this project, a defensemen has led in assists five times. So there is probably some tweaking to be done.
At first, I wanted to compare real life stats to the actual season (2019-20). The idea was to grab one team’s scoring, figure out who was on the ice for each goal, and simulate awarding assists. However, I was thwarted by this as the NHL does not make the individual +/- for a goal available in their public API anymore (an API is a method of retrieving data without going web page by web page.)
So I still had some data leftover from some of my other innovation investigations from 2012-13. I picked the most average team available (Columbus), and ran each goal through the current assist rules 10,000 times in order to get an average of each goal.
In that season, Columbus had 205 assists — 64 from the D and 141 from the forwards — for a percentage of 31% for the D. In my first run of the normal rules, I only had on average 185.4 assists per season, as Columbus was a bit above average in receiving assists. That being said, the average simulation saw more D assists (68.1) and a lot less from the forwards (117.3), for a D percentage of 37%. So maybe some tweaking needed to take place.
As a lark, for the second trial, I went back to the original 1.0 game rules, which was simply check from High-to-Low for all assists, rather than rolling for an initial position first. Although the D percentage was better (35%), players with higher assist ratings were wildly higher and players with lower assist ratings were significantly lower.
So for the third test, I tweaked the rules that instead of a one die roll to determine the first position, I went with two (LW: 11-22, C: 23-34, RW: 35-46, LD: 51-53, RD: 54-56, Rank: 61-66.) With this setup, the D percentage was 32% and everyone was pretty proportional to their actual number.
The fourth test was to see what would happen if we went a little closer to the current rules (LW: 11-21, C: 22-32, RW: 33-43, LD: 44-52, RD: 53-61, Rank: 62-66.) This ended up being a little worse with the D percentage was 34%, although the proportions were similar. With that being equal, I would still lean towards the results in the third test.
However, when typing up the new chart, I realized the positions within forwards and within defensemen weren’t equal. So after six more trials, and sparing you the details of those tests, I finally came up with a chart I’m going to use in my next season, one that had a 31% D assist percentage and better proportionality than the original winning test:
Dice Roll
Assist Order
11-22
LW-C-RW-LD-RD-G
23-26
C-RW-LW-LD-RD-G
31-34
C-RW-LW-RD-LD-G
35-46
RW-LW-C-RD-LD-G
51-54
LD-LW-RD-C-RW-G
55-56
LD-C-RD-RW-LW-G
61-62
RD-C-LD-RW-LW-G
63-66
RD-RW-LD-LW-C-G
So this begs the question, if all things are equal, how come the defensemen get more assists. The reason is that forwards score goals more often, and therefore are removed from the check, giving defensemen more of a chance to get the assist. By tweaking the chances for each position, and giving forwards more of a chance, the numbers work out much better.
One unfortunate aspect of the APBA Hockey experience is determining the defensive effects. The system uses what is a simple “add the five numbers and refer to the chart to determine the difference.” However, that can slow you down in trying to remember what the defense ratings are, and it really doesn’t take any individual performance into account.
WARNING!! This system involves having either using a third die, or using a reroll. In the text below, I will refer to this as the “extra” die. Two-die/no reroll purists should probably leave this article now.
The system I use is based on how I set up my players on my table:
Vis RW (6-H LD)
Vis RD (6-H LW)
Vis C (6-H C)
Vis LD (6-H RW)
Vis LW (6-H RD)
Vis Goalie
1
2
3
4
5
Extra Die
Home LW (6-V RD)
Home LD (6-V RW)
Home C (6-V C)
Home RD (6-V LW)
Home RW (6-V LD)
Home Goalie
If a play result for the skater is either 1-7 or 10-20, refer to the extra die. Look at the result and you’ll see the position of the player whose defense rating that will be used. For example, if a home skater has the puck, and you have a ‘4’ on the extra die, you would use the Vis LD defensive rating – no matter who has the puck for the home team. Similarly, if the away skater has the puck, you would use the Home RD defensive rating.
If the extra die is a ‘6’, look at the box with the puck holder, and the player listed in red parentheses is your defender. For example, the home RW would have the visiting LD defending. Or, the visiting RD would have the home LW defending.
Now that you know the defender, use the position rating to apply the defense:
Defense Rating 5: Add 3 to the play result
Defense Rating 4: Add 2 to the play result
Defense Rating 3: Add 1 to the play result
Defense Rating 2: Do not change the result
Defense Rating 1: Subtract 1 from the play result
Defense Rating 0/Position Empty: Subtract 2 from the play result
Remember in these instances not to leave the 1-7 or 10-20 ranges. You can’t go above 1 or below 7, nor can you go above 10 or below 20.
I know this seems like a lot of text, but once you start using this, your games will go faster and are more accurate. The key is setting up the players as in the grid before. You will naturally learn to go the correct column very quickly. The ‘6’ is a bit trickier, but it’s simply who the logical defender would be in a real game of hockey.
Since I’ve sort of become the person to over-innovate the APBA Hockey game, especially the penalty chart, there should be little surprise I have an additional chart. This one allows you to actually record the penalty called, even though it really doesn’t matter. It’s just if you want to add a little fun to the game.
Roll the two dice and add them up. Check Column A in the chart below. Unless it says “Check Column B”, that is your penalty. If it says “Check Column B”, reroll and check again. Note that in Column B there may be different results depending on whether the penalized player was a defenseman or a forward.
Roll
Column A
Column B
2
Boarding
Diving
3
Cross Checking
F=GK Interference; D=Interference
4
Interference
Elbowing
5
Holding
Unsportsmanlike Conduct
6
Tripping
F=GK Interference; D=Interference
7
Hooking
F=Interference; D=Delay of Game
8
Check Column B
Delay of Game
9
Check Column B
Holding the Opponent’s Stick
10
Slashing
Delay of Game
11
High Sticking
Charging
12
Roughing
Kneeing
If you have matching minors, roll two dice for each player and add them up. If you roll a 2, 3, or 4 — it’s high sticking for that player. A 5 is slashing, while 6 through 12 is roughing.
This was compiled from penalty statistics from 2016. If you’re playing an older season, you may want to swap out GK Interference and Delay of Game for other penalties, as they were not called as frequently as they are today.
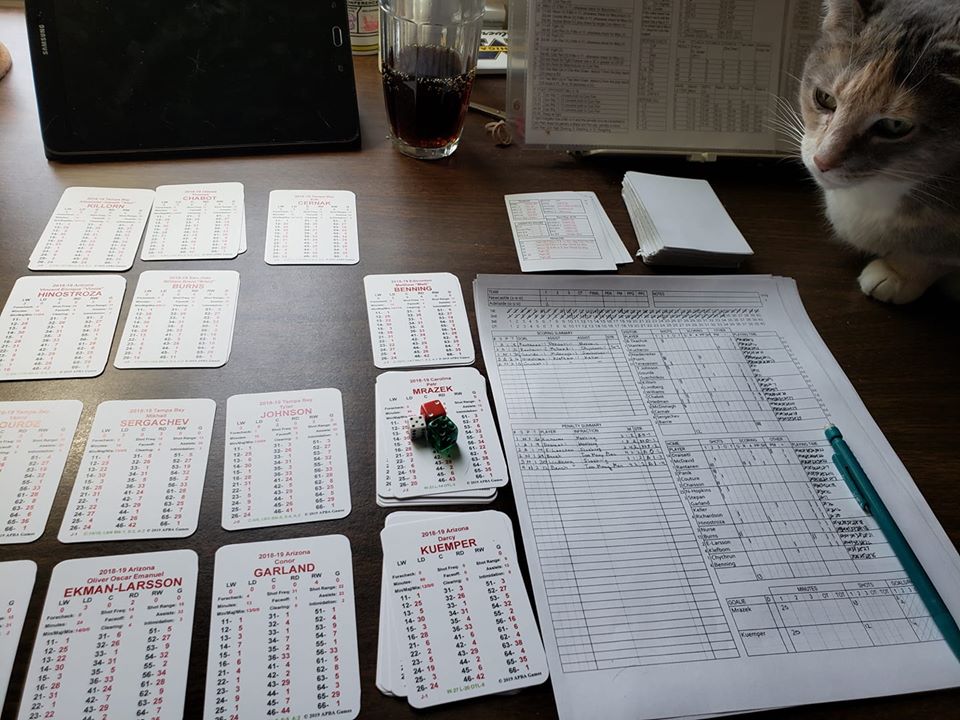
I had posted a picture of my cat on the APBA Games Facebook group watching me play a hockey game. Nobody commented on who the team were or that I’m insane enough to capture time played. However, a couple eagle-eyed posters noted a stack of cards that looked different.
Shana watches the game action.
Am I daring to play an APBA with something other the two standard dice? Well, yes, I do regularly commit APBA blasphemy. Ignore the third die for now, we’ll cover that in another post.
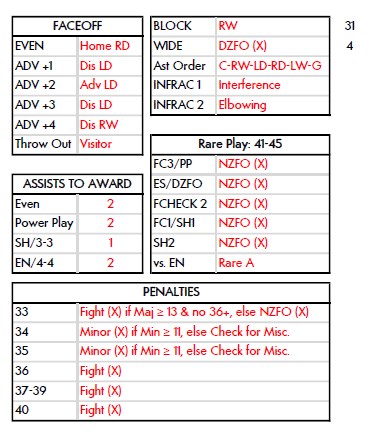
For those who have played the APBA Soccer game, you may have an accessory known as a fast action deck. This essentially combines a dice roll with a board read, a time saver for those especially for those hard to memorize plays. This is basically the same concept, but for hockey. Here is an example card:
There is one card for each of the possible 36 dice combinations. On each card are the results for that dice roll for a few of the more common board lookups. Note that in the case of some of the items, they’re modified a bit from the regular boards because I have found them to be more accurate. In a typical game I usually use about 1 1/2 decks.
How to use the card
Faceoffs are pretty self-explanatory, and match exactly what is on the board.
The assists are actually in two spots. On the left is the number of assists to award depending on the situation, while on the right is the order to determine who gets assists in the same manner you would do in the regular game. The reason for the split in situation is that the number of assists awarded tend to be situation-dependent (more on power plays, less on shorthanded, for example.)
Block and Wide work the same as the boards.
INFRAC1 and INFRAC2 are not found in the game. If you get a minor penalty, use the INFRAC1 value for what the penalty type is. If it says ‘INFRAC2’, flip to the next card and use the value under INFRAC2. Occasionally the value will be dependent on the position of the penalized player, and is denoted by F or D.
The rare play portion works pretty much like the regular boards, except which number was called is not important, just that a play result of 41-45 was hit. ‘Rare A’ refers to the first column of the rare play chart, ‘Rare B’ the second, and so forth. Also appearing could be a bench minor (so no need to double-check for that) or the incredibly rare goalie shot.
The penalty grid at the bottom of the card don’t match the game exactly, rather they remove some of the situational-dependent penalties and make them more a random chance. Note that when conferring to determine a penalty:
If shorthanded, use 33 instead of 34
If two-men down, use 33 instead of 34 or 35
If a 36-41 is used and a fight is indicated, use the following changes once you have determined the opponent:
A reroll of 11-21 and an opponent Major rating of 11 converts both penalties to coincidental minors.
A reroll of 22-32 and an opponent Major rating of 11 converts both penalties to coincidental minors.
A reroll of 33-43 and an opponent Major rating of 11 converts both penalties to coincidental minors.
A reroll of 44-54 and an opponent Major rating of 11 converts both penalties to coincidental minors.
A reroll of 55-66 keeps the penalties as matching fighting majors.
This is all great, but don’t you want a copy of these? Well sure you can. Below is a link to a 4-page PDF that will have one set of 36 cards. I recommend printing two sets on to card stock, and cut them in ninths so they resemble a card deck. As mentioned earlier, you will likely use 1-2 decks per game.
There was a recent thread on the APBA Baseball Facebook page about the 1968 reissue set, namely that Bob Gibson no longer has a Z. For those who may not be familiar, 1968 was the year of the pitcher, and it was a season APBA had a little difficulty creating the first time around.
In the original set, there were three starters who were graded A&C: Bob Gibson (plus an XZ), 31-game winner Denny McLain (XZ), and AL ERA champ (1.60) Luis Tiant (XYZ). In the older formulas, McLain was an “automatic” A&C since he had 30+ wins. At this point, the A&C as a starting grade had only been given once before — two years earlier to Sandy Koufax — although it had been given in the past to OFAS pitchers. To somewhat counter the high number of A and A&C pitchers, cards were given an extra 7.
It would be pretty impossible to get a 1.12 ERA from an A&C, even in the deflated year of 1968. A baseline was set with Tiant getting the A&C for 1.60, and you would think there would need to be some sort of improvement to get to 1.12. The one basic game replay I could find had Gibson’s ERA at 1.55.
In the reissued set, Gibson got an upgrade to A&B (MG 25), but he lost the Z. McLain also got a bump to 25, kept his Z but gained an L (he did give up 31 dingers to lead the AL). Tiant stayed at A&C (MG 20) but lost his Z as well.
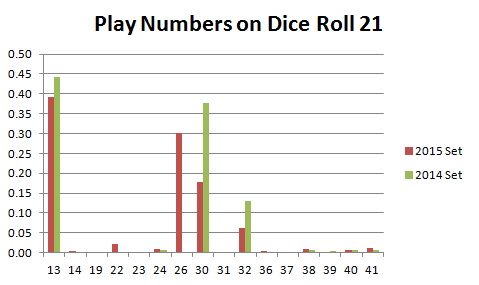
I started playing some games with the 2015 baseball set this week. One thing I begin to notice was a red 26 on dice roll 21. I had never really seen that before. So I began to wonder:
Did APBA assign more 26s? Nope, the average card in 2014 had 1.28, and the average card in 2015 had 1.29.
Can players get a third 26? Nope, not a single card in either 2014 or 2015 had a third 26.
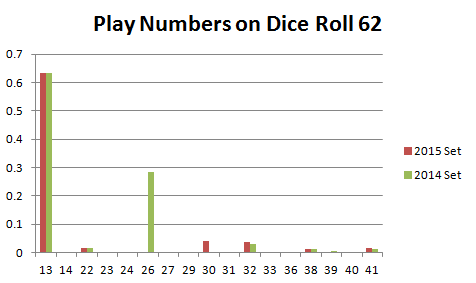
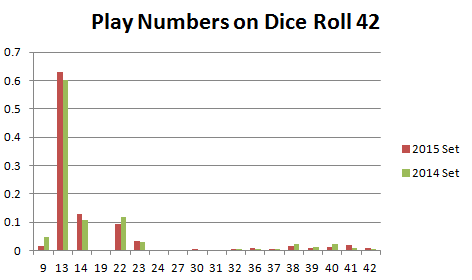
So as seen below, the second 26 had merely swapped positions, leaving 62 for 21 (the x-axis representing the play result and the y-axis representing the percentage of plate appearances with that particular play result):
However, on a swap, you would expect the now much lower counts of 30 and 32 to take the place the relocated 26. However, although there are some, it’s not complete. The sum of the 2014 fly balls on 21 is .51 vs the 2015 sum of .24, but the sum of the 2015 fly balls on 62 is .07, only a .04 increase from 2014’s .03.
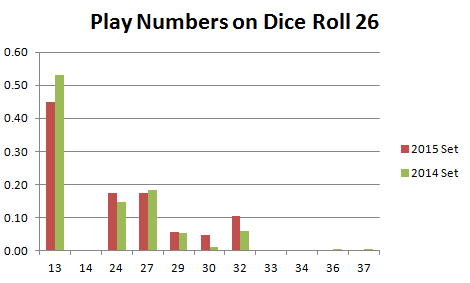
Do we have less 30s and 32s? A touch less, but not much. The 30 saw a decrease of 1.51 to 1.44, and the 32 1.52 to 1.49. However, that’s only a total of .10. So where did they go?
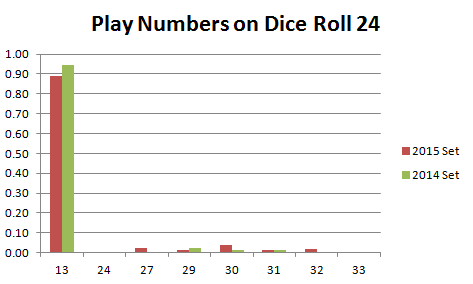
It looks like 24 and 26 became more popular destinations, although their increased presence is more than overshadowed by the 13:
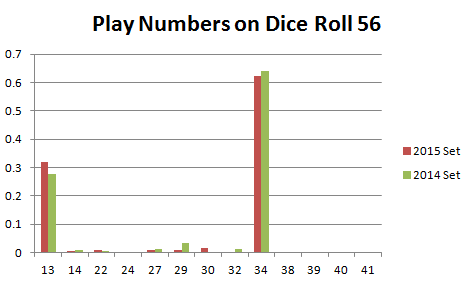
Since the number of 13s remain largely unchanged (5.93 in 2014, 5.94 in 2015), the ones displaced from 21, 24, and 26 scattered to other numbers, especially 42 and 56.
Before wrapping up, I just thought I would mention one other curiosity, that even though the play numbers of 24–32 on the cards in the 2015 set aren’t that different from 2014, the ratios of them seem to be somewhat different. Here’s a list of the top 10 sets from 2014 and 2015:
2014 Out Numbers
Percentage
25-26-27-28-29-30-31-32
.024
24-25-26-27-28-29-30-31-32
.023
25-26-27-28-29-30-30-31-32-32
.020
24-25-26-27-28-29-30-31-31-32
.018
25-26-27-28-28-29-30-31-31-32
.018
25-26-27-28-28-29-29-30-30-31-31-32
.018
25-26-27-28-28-29-30-30-31-31-32
.016
25-26-27-27-28-28-29-29-30-31-31-32-32
.016
24-24-25-26-27-29-30-31-32
.016
24-25-26-26-27-27-28-29-29-30-30-31-31-32
.016
2015 Out Numbers
Percentage
25-26-27-28-29-30-31-32
.029
24-25-26-27-28-29-30-31-32
.027
24-24-25-26-27-28-29-30-31-31-32
.021
25-26-27-28-28-29-30-31-31-32
.021
24-24-24-25-26-27-28-29-30-31-31-32
.020
24-25-26-27-28-29-30-31-31-32-32
.017
25-26-27-28-28-29-29-30-31-31-32
.016
25-26-27-28-28-29-29-30-30-31-31-32
.016
24-25-26-26-27-28-29-30-31-31-32-32
.015
25-26-27-28-28-29-29-30-30-31-31-32-32
.015
The #8 combination in 2014 disappears entirely, and #3 is barely used in 2015. I don’t know if this is something that happens every year, or just something unique to the 2015 set. Something to explore for another day.
After spending our time figuring out how to calculate an APBA hockey card not once, but twice, we’ll move onto the final installment, the goalie. Just like the relief pitcher in baseball, they can be unstoppable one day and a disaster the next, and finding a good one long term is next to impossible. So instead of finding one, let’s just try to calculate one.
The concept of the goalie card is simple. The card is called upon to redirect a saved puck or say a goal has scored. About 80% of the time, it will always be a redirection. About 20% of the time it will determine whether a goal has scored, and even a 0.2% difference is different from one card to the next. Each card contains the following sets of numbers:
1–6: the always save numbers
7–18: the sometimes a save, sometimes a goal numbers – a card will at most have one of these
19–45: the always a goal numbers
The stats you will need to calculate the card are not much and are available for many of the seasons:
In the previous post, I discussed how to create the non-play number portion of a hockey card. In this article, we move on to the actual play numbers. Unlike the familiar baseball card, this is somewhat straight forward and transparent. And like the previous post, this is not perfect, there will be some deviance as not all of the parameters are known.
Before we can go placing numbers on the card, we need to calculate a few things. All of the stats you will need were listed in the previous post.
You will need to figure out the penalty numbers. How to do that is listed in this post.
Next is the number of 9’s (power play-only shots) needed. This is calculated by the percentage of goals that are power play goals: 1-25%=one 9, 26-34%=two 9s, 35-49%=three 9s, 50-59%=four 9s, 60-74%=five 9s, 75-80%=six 9s, 81-89%=eight 9s, 90-99%=nine 9s, 100%=ten 9s.
Determine the number of 30s desired to award penalty killers. These are based on reputation, a good method would be to sprinkle anywhere between 0 and 4 extra 30s among the team depending on the overall effectiveness of the team’s penalty kill unit. Forwards mostly get the extra 30s, defensemen getting them are rare.
Determine the shots on goal taken per 60 minutes, otherwise known as S/60M.
You will also need the number of games played and the Assist rating.