In the original National Pastime game, the only thing that a pitcher contributed was hitting. There were no grades, no subratings, no handicaps. When APBA came out in 1951, the concept of the grade was added, so now pitchers fell into six classes: A&C, A&B, A, B, C and D. The grade was pretty much determined by two factors: ERA and innings. Six years later, the subratings were added: 3 for control and 4 for strikeouts. You now had 72 different classes of pitchers, but in reality you really had 12: 4 grades and 3 control subratings. The strikeout subratings were of little overall effect and the A&C and A&B grades rarely came into play.
When the Master Game came into play, the number of grades increased from 6 to 30, with each grade divided into 5 parts. There were no additional control or strikeout subratings, but additional subratings were added for homers, wild pitches, balks, hit by pitch and holding runners. The only ratings that really made a material difference where the homer ratings: 5 additional ratings and approximately 20 effective grades jumped the classes to 1,500. In a quirk of the computer vs. Master Game, the latter now has an additional control rating and 4 additional strikeout ratings.
A while back, I ran a simulation of the various hit numbers. I then did the same thing, this time concentrating on the pitching grades. Instead of drowning you in numbers, I’m going to go the pretty route and drown you with charts. First up I simply ran a 5-season simulation on every grade from 1 through 30 with all of the ‘neutral’ subratings: no control, no strikeout and no homerun. Here is a comparison of a few of the stats for each simulation:
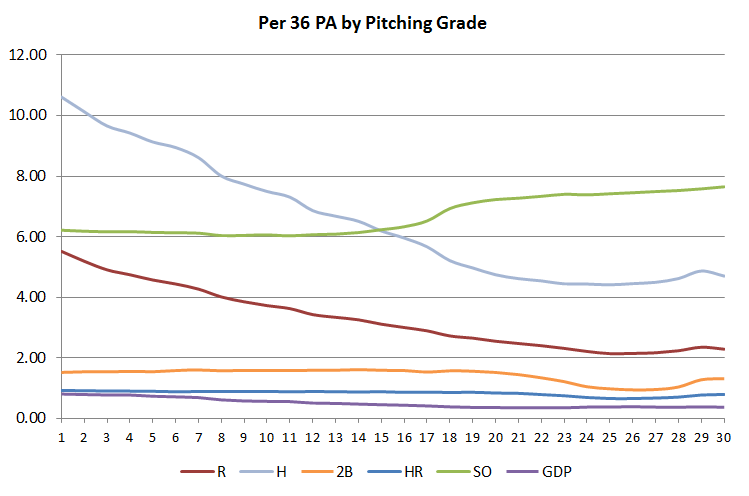
Looking at that most important stat of runs, we notice that as the grade gets higher, the amount of difference lessens a little bit, and then craters, and actually goes up a little bit at the end. We see the same effects with hits and doubles, although hits stops its descent later, but has the same crater and uptick pattern. Home runs stay relatively constant until a slight descent in the 20s, strikeouts stay relatively constant until the 9 into a 13 kicks in at the A level (grades 18 and above). Double plays gently decline as there are fewer runners to double off in the higher grades.
So the basic formula I came up with to determine the R/36 PA variance away from the mean is listed below. I’ve included a translated version to ERA (if you’re more comfortable with that) in italics:
- Grade 1: 1.5 R/36 PA greater or 2.12 ERA greater.
- Grade 2: 1.15 or 1.63.
- Grades 3 through 7: .85 – .15(Grade – 3) or 1.2 – .22(Grade – 3)
- Grades 8 through 12: -.15(Grade – 8) or –.19(Grade – 8)
- Grades 13 through 17: -.7 – .1(Grade -13) or -.87 – .13(Grade – 13)
- Grades 18 through 24: -1.3 – .09(Grade – 18) or -1.59 – .09(Grade – 18)
- Grades 25 through 27: -1.9 or -2.16
- Grade 28: -1.8 or -2.07
- Grade 29: -1.7 or -1.95
- Grade 30: -1.75 or -2.02
So basically an 8 is average. And it looks like the long held belief that an A&C pitcher (grades 23-27) is a little more advantageous than an A&B (28-30), with the ability to knock out the 9 with a runner on 1st more important than knocking an 8 down with a runner on 3rd or runners on 2nd and 3rd.
In the early days of the subratings, it was noted that they were likely determined by BB/9 IP and SO/9 IP. At some recent point, APBA has changed that philosophy and started using plate appearance as the denominator. This was a smart move, as the BB/9 and SO/9 varies by the number of outs you create, but stays constant for the batters you face. As an example, I took the data from above, and plotted it on both an per 9 IP and per PA/36 basis:
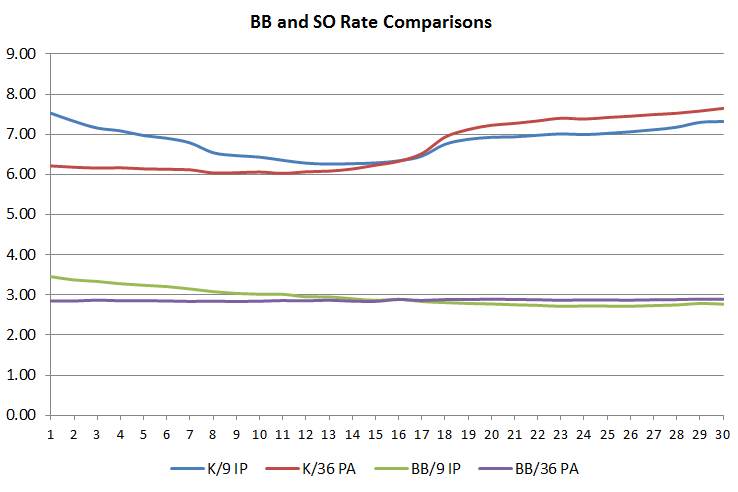
Notice how the BB/36 PA stays relatively constant: it does go up a slight bit as the opportunities where the Z comes into play goes down a bit since there’s less runners on with better pitchers, while the BB/9 IP slowly declines. With strikeouts it’s a little more pronounced, but the same thing happens that around Grade 15 they pass each other. Since the per 36 PA seems to give a better indication of what is going on and is likely used by APBA, I will be using those when describing the subratings. Also, to keep this from becoming impossible to manage with dozens of tests for every grade, I only tested grades 3, 8, 13, 18, 23 and 28.
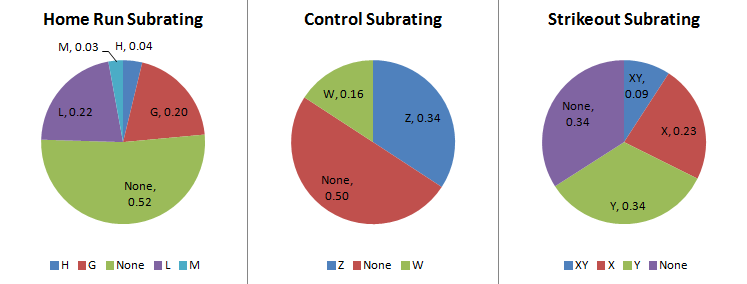
When dealing with home run ratings, it became obvious that the non-HR rated pitcher will give up a little less homers (.90 per 36 PA) than an average replay with the ratings distributed (.94). This difference is made up with the bad HR ratings (L and M) causing more home runs than the good HR ratings (G and H) take away.
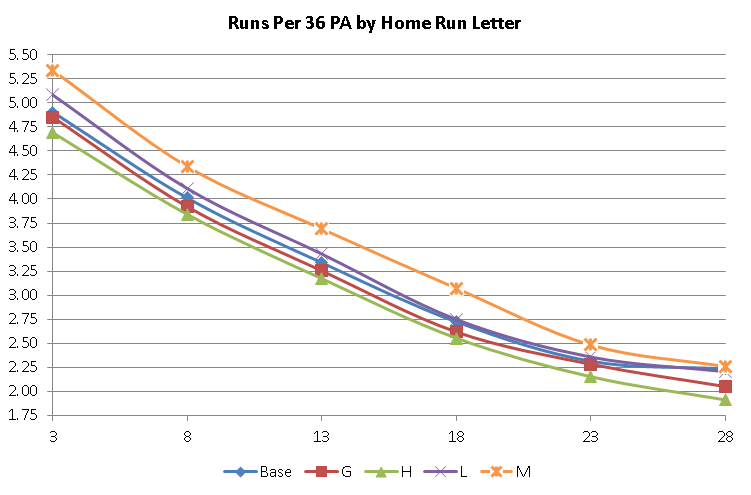
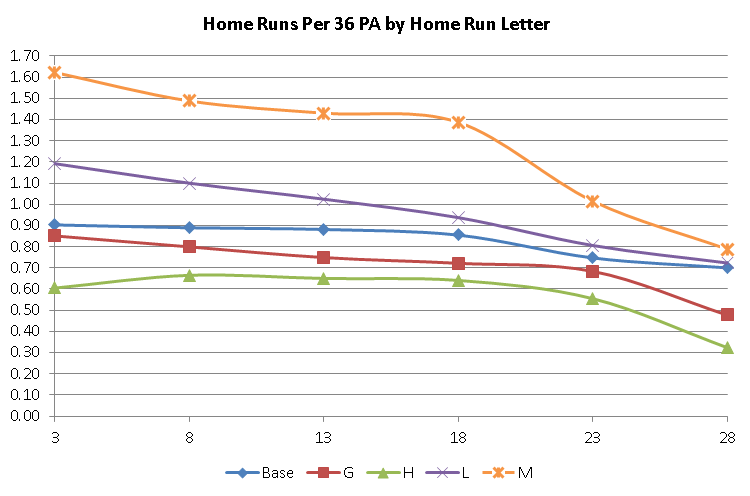
Notice that the line for M is furthest away from the baseline, the H is far away but not the distance of M. G barely leaves the path while L does go a bit away, and the effects of the letters are more pronounced with the poorer grades than the better ones. A similar patterns occurs with the actual HR/36 PA. However, that patterns seems a bit odd, since the home run letters only affect the ‘1’ play result and other factors affect home runs from the ‘2’ through ‘6’ numbers. Makes you wonder if something else is at play.
Since it’s pretty difficult to give a set formula due to the vagaries of what grade the pitcher is for both the run and home run differences, I’ll just present a chart:
| Per 36PA | Runs | Home Runs | ||||||
| Grade | H | G | L | M | H | G | L | M |
| 3 | -.21 | -.05 | +.18 | +.43 | -.30 | -.05 | +.29 | +.72 |
| 8 | -.17 | -.09 | +.10 | +.33 | -.22 | -.09 | +.21 | +.60 |
| 13 | -.17 | -.08 | +.09 | +.35 | -.23 | -.13 | +.14 | +.55 |
| 18 | -.17 | -.11 | +.02 | +.35 | -.21 | -.13 | +.08 | +.35 |
| 23 | -.16 | -.03 | +.04 | +.17 | -.19 | -.06 | +.06 | +.27 |
| 28 | -.32 | -.18 | -.03 | +.02 | -.38 | -.22 | +.02 | +.09 |
With walks, the computer game does not have capacity for the ZZ, although it is unknown if the 5.75 update has added them (there are no 2012 pitchers rated ZZ to check). Similar to the home run rating, the bad rating (W) has more impact than the good rating (Z). However, the unrated pitcher will have a higher BB/36 PA (2.87) than the the baseline (2.80), since there are many more Z pitched innings than W. First the charts:
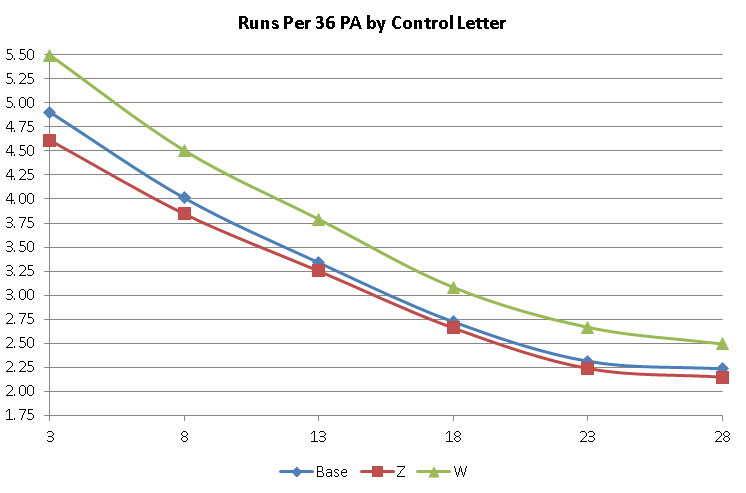
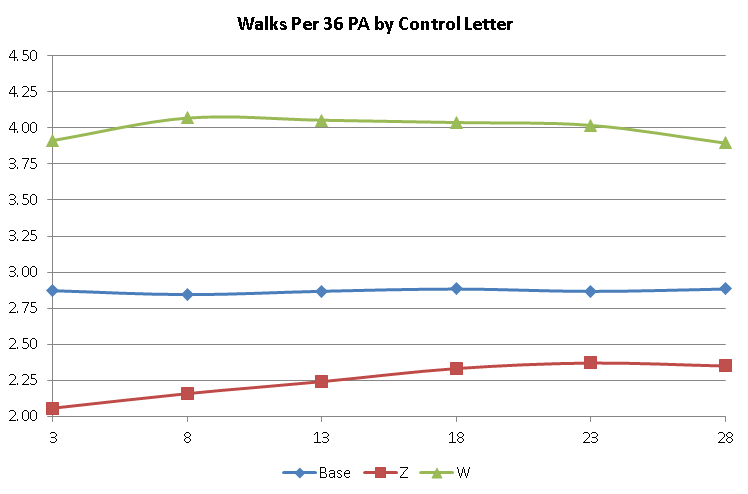
The effects are a little more linear, but there are impacts of the grade on the final answer. So instead of a formula, I’ll throw in another chart:
| Per 36PA | Runs | Walks | ||
| Grade | Z | W | Z | W |
| 3 | -.29 | +.59 | -.82 | +1.04 |
| 8 | -.15 | +.50 | -.69 | +1.23 |
| 13 | -.09 | +.45 | -.63 | +1.19 |
| 18 | -.06 | +.36 | -.55 | +1.16 |
| 23 | -.08 | +.35 | -.50 | +1.15 |
| 28 | -.09 | +.26 | -.53 | +1.01 |
One of the things we can do with this data is to find out what a ‘Z’ is worth. Although it is grade-dependent, it basically is a bonus bump on your grade, while a W is probably worth up to a penalty of 4 points in the mid range and 2 at the extremes. An H is worth a point or two depending on the initial grade. A G or L is either a half or whole point depending on the initial grade, while an M is a 2 or 3 point penalty. The strikeout letters proved to be of little change to the results.
On a final note, here are the percentages for each grade in the 2012 set and their subrating breakdowns. Notice that the bad ratings tend to be with the lower grades, and the better ones tend to be with the higher grades. Not going to find too many 19-Ms out there:
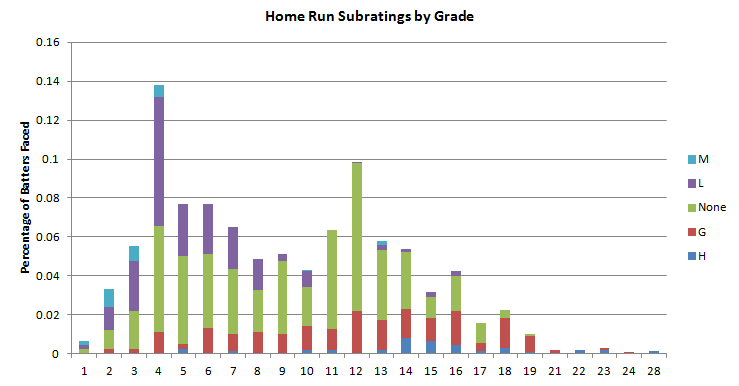
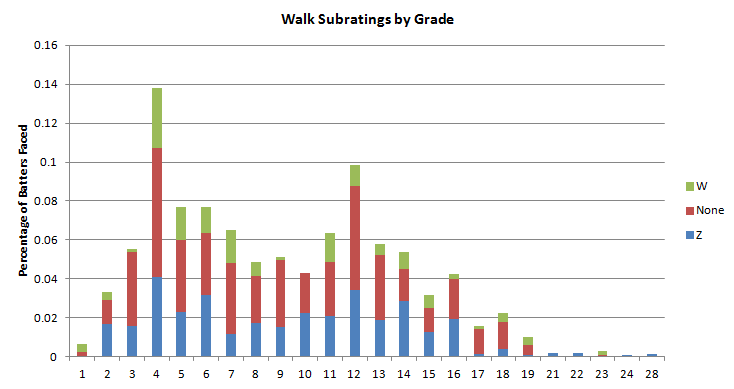
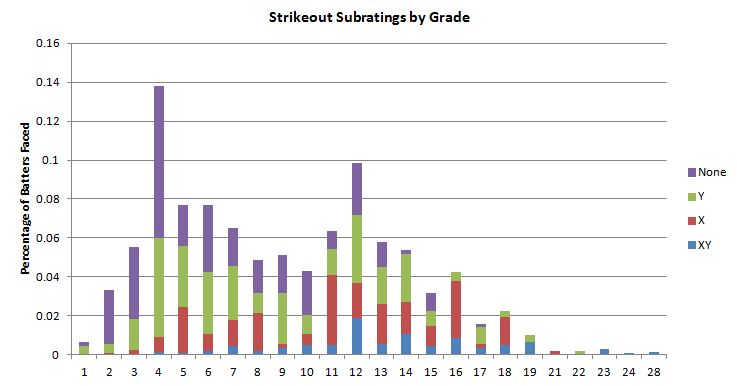
One thing to note here is that even though the average grade is an 8 as mentioned earlier, the midpoint of the grades is pretty much between 8 and 9, as the weight of the bad numbers (especially the W) drive the relative grade (assigned grade plus subrating effects) does bring it down a bit.
Next up, the fielders.
I enjoyed this study! I had two questions for you. (1) Did you ever do anything with the data in this study? Did you use it to see how closely you could rate pitchers in a season or two to the actual ratings? (2) I was a little confused on the data in the table concerning grades. It looked like overlaps? I understand overlaps and scrambling in the high grades (A&B versus A&C). I admit, I mostly paid attention to ERA variances not the R / 36 PA. Very interesting data. Thanks, Bill.